
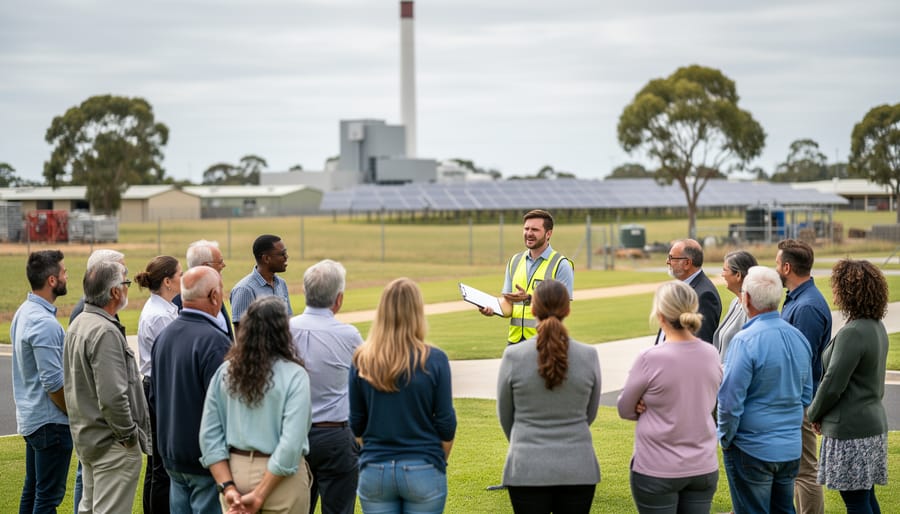
KPIs for community engagement are measurable indicators that track how effectively local communities participate in, support, and benefit from energy projects, particularly renewable initiatives like bioenergy. These metrics go beyond simple headcounts at consultation meetings. They capture the depth of involvement, the quality of relationships built, and the tangible outcomes communities experience when energy projects land in their backyard.
For anyone managing a renewable energy project in Australia in 2026, these KPIs have become essential tools. They answer the question that funding bodies, local councils, and communities themselves are asking: is this project genuinely creating value for the people it affects, or is it just ticking boxes?
The stakes are higher than many realise. A wind farm in regional Victoria might generate clean power, but without genuine community buy-in, it can face years of opposition, legal challenges, and reputational damage. Conversely, a smaller bioenergy facility that tracks and optimises its community energy impact can build lasting partnerships, secure social licence faster, and even unlock better financing terms.
This article breaks down the KPIs that matter most for community engagement in Australian renewable energy projects. You’ll discover what these metrics actually measure, how they work in practice, the different categories you should track, and how leading projects are using them to transform community relationships. The focus stays practical throughout, with real applications drawn from bioenergy initiatives across the country. Whether you’re launching a new project or refining an existing one, understanding these KPIs will help you build stronger, more resilient community partnerships that deliver benefits everyone can see.
What Community Engagement KPIs Mean for Energy Projects

When energy projects talk about community engagement KPIs, they’re referring to measurable indicators that show how well a project connects with and involves the people it affects. Unlike the KPIs most energy companies track, megawatt hours generated, project timelines, or return on investment, community engagement metrics zero in on the human side of renewable energy: Are locals informed? Do they feel heard? Are they actively participating in the project’s success?
Think of traditional energy KPIs as measuring what the project delivers, while community engagement KPIs measure how the community experiences that delivery. A solar farm might hit every technical benchmark and still struggle if nearby residents feel excluded from decision-making or uncertain about local benefits.
- KPI
- A Key Performance Indicator is a measurable value that shows progress toward a specific goal, in community engagement, these track relationship quality and participation levels rather than purely technical outputs.
- Community Engagement
- The ongoing process of working collaboratively with people affected by an energy project, involving two-way communication, consultation, and shared decision-making throughout the project lifecycle.
- Stakeholder Participation
- The active involvement of community members, local organizations, and interest groups in project activities, from planning meetings to operational feedback sessions.
- Social License to Operate
- The informal approval and ongoing acceptance a project earns from the local community and broader society, distinct from formal permits and crucial for long-term viability.
- Impact Metrics
- Quantifiable measures that capture the social, environmental, and economic effects of a project on the community, beyond standard financial performance indicators.
These specialized KPIs matter because renewable energy projects in Australia increasingly succeed or fail based on community support. A bioenergy facility measuring only tonnes of waste processed misses whether locals understand its benefits or trust the operators. Engagement KPIs fill that gap by tracking awareness levels, sentiment shifts, participation rates, and whether community concerns translate into project improvements.
The distinction is practical: while a project manager might celebrate meeting a construction deadline (a traditional KPI), community engagement KPIs would measure whether residents attended information sessions about that construction phase, understood the timeline, and felt their traffic concerns were addressed. Both matter, but they measure fundamentally different aspects of project success, one technical, one relational. For Australian energy initiatives aiming to build lasting community partnerships, these relational metrics often determine whether a project becomes a local success story or a source of ongoing tension.
How Community Engagement KPIs Work in Practice

Measuring community engagement isn’t about ticking boxes, it’s about creating genuine feedback loops that shape how energy projects develop. The process starts with baseline data collection before a project launches. Energy developers run initial surveys to gauge community awareness, conduct focus groups to understand local concerns, and map existing networks of community organisations. This groundwork establishes what “normal” looks like, giving you something concrete to measure progress against.
Once a project gets underway, data flows from multiple channels. Community meetings generate attendance records that track who’s showing up and whether participation is growing or plateauing. Sign-in sheets capture demographic information, revealing whether you’re reaching diverse age groups, cultural backgrounds, and socioeconomic segments. Digital platforms add another layer: website analytics show how many locals are visiting project pages, email open rates indicate message resonance, and social media engagement metrics reveal which topics spark conversation.
Surveys remain the workhorse of engagement measurement. Short pulse surveys after consultation sessions capture immediate reactions, while quarterly community surveys track shifts in awareness and sentiment over time. The best surveys mix quantitative scales (rate your trust in this project from 1-10) with open-ended questions that let people express concerns in their own words. Australian bioenergy projects often include questions about specific local benefits, job creation expectations, land use preferences, or odour concerns around organic waste facilities.
Feedback sessions and community advisory groups provide qualitative depth that numbers alone can’t capture. Recording attendance, documenting questions raised, and tracking how many community suggestions get incorporated into project design all become measurable KPIs. When a Victorian bioenergy project adjusted its truck routes based on resident input, that responsiveness became a data point showing genuine engagement.
The real power emerges when project teams regularly analyse this data and act on it. Monthly dashboards highlight trends: Is participation dropping in certain neighbourhoods? Are awareness levels stagnating? Have recent communication efforts shifted sentiment? These insights drive tactical adjustments, adding translation services, scheduling meetings at different times, or addressing specific concerns through targeted information campaigns. The cycle repeats, creating a living measurement system that evolves alongside community needs.
Essential Types of Community Engagement KPIs
Participation and Reach Metrics
Participation and reach metrics answer the fundamental question: who’s showing up? These KPIs track the breadth and depth of community involvement in energy projects by counting heads and analyzing who those heads represent.
Attendance figures from community meetings, information sessions, and workshops provide a baseline measure of interest. A bioenergy facility proposal in regional Victoria, for instance, might track attendance across multiple consultation rounds to gauge sustained engagement versus one-off curiosity.
Digital reach extends this measurement beyond physical gatherings. Newsletter subscriber counts, social media followers, website visitors, and email open rates reveal how many community members are staying connected to project updates. These metrics matter because passive information consumption often precedes active participation.
The most revealing participation KPI is demographic diversity. Are you reaching older residents but missing young families? Engaging homeowners while overlooking renters? Tracking age groups, postcodes, language backgrounds, and socioeconomic indicators ensures your engagement isn’t accidentally creating an echo chamber. A truly successful renewable energy project reflects its entire community, not just the loudest voices or the most readily available participants.
Awareness and Understanding Indicators
Awareness and understanding metrics reveal whether your message is getting through. These KPIs track how well community members grasp what your energy project does and why it matters, moving beyond simple attendance to measure genuine comprehension.
Pre- and post-event surveys are your primary tool here. Ask participants to explain the project in their own words or identify key benefits of bioenergy. Track the percentage who can accurately describe how biogas is produced or name one environmental benefit. These knowledge-check questions show whether community energy education efforts are working.
Project awareness rates measure recognition within your target area. Simple polls asking “Have you heard of the [Project Name]?” establish baseline visibility, while follow-up questions gauge depth of knowledge. For instance, a Victorian biomass facility might track how many nearby residents understand it converts agricultural waste to power rather than burning fossil fuels.
Perception surveys assess whether communities recognize environmental impacts accurately. Do locals know the tonnes of CO₂ avoided? Can they connect the project to local job creation? These understanding indicators help you refine messaging and spot misconceptions before they become opposition.
Sentiment and Satisfaction Measures
Understanding how communities feel about energy projects matters as much as tracking who shows up. Sentiment and satisfaction measures capture the emotional and relational health of your engagement efforts, crucial signals that predict long-term project support.
Support level tracking gauges overall community backing through regular polling: “Do you support this bioenergy facility?” Results might show 65% support at project announcement, rising to 78% after transparent consultation. Declining support signals problems requiring immediate attention.
Satisfaction scores measure how well the engagement process itself is working. Post-workshop surveys asking participants to rate their experience on a 1-10 scale reveal whether people feel heard and valued, not just informed.
Feedback sentiment analysis reviews comments from surveys, public meetings, and social channels to identify positive, negative, or neutral themes. A Victorian solar farm discovered through sentiment tracking that concerns weren’t about the technology itself but construction traffic, a fixable issue they’d otherwise have missed.
Trust ratings ask communities to score their confidence in project developers and decision-making transparency. High trust correlates strongly with project success.
Perceived fairness metrics assess whether consultation processes feel equitable: “Did you have genuine opportunity to influence outcomes?” Fair processes build lasting community partnerships, even when not everyone gets their preferred result.
Action and Behaviour Change Metrics
The most telling KPIs measure what communities actually do rather than what they say they support. Adoption rates track how many households or businesses switch to renewable energy options, install solar panels, or connect to bioenergy district heating systems. Behaviour change metrics capture shifts in energy consumption patterns, waste sorting for bioenergy feedstock, or participation in demand response programs. Local employment figures show whether the project creates jobs for community members, from construction roles to ongoing operational positions. Investment metrics are particularly powerful: they measure community members purchasing shares in power cooperatives contributing to crowdfunding campaigns, or taking up co-ownership models. When a regional Victorian bioenergy facility tracked these action KPIs, they found that 40 percent of local farmers actively supplied feedstock within two years, and 15 percent of households became financial stakeholders. These numbers demonstrate genuine community buy-in that translates into project resilience and long-term viability far beyond passive support measured in surveys.
How Energy Projects Apply These KPIs
Community engagement KPIs come alive when applied throughout an energy project’s lifecycle, turning abstract metrics into actionable insights that shape real outcomes. Australian renewable energy developers use these indicators strategically at every phase, from initial feasibility studies through decades of operation.
During the planning stage, project teams deploy participation metrics to gauge community readiness and identify key stakeholders. A biomass facility proposed for regional Victoria, for example, tracked attendance at early consultation meetings and mapped demographic diversity to ensure rural voices weren’t drowned out by urban participants. Awareness surveys conducted before formal planning applications revealed knowledge gaps about bioenergy benefits, prompting the developer to launch targeted education sessions that later showed measurable improvement in understanding scores.
As projects move into development, sentiment and satisfaction KPIs become crucial navigational tools. Many local government programs in New South Wales now require quarterly sentiment tracking through community surveys and feedback sessions, with results directly influencing design modifications. One solar-plus-storage project in regional Queensland adjusted its grid connection route after satisfaction scores dropped in response to the original proposal, demonstrating responsive decision-making.
Throughout the construction and operational phases, action and behaviour change metrics demonstrate tangible community involvement. Successful projects track local employment numbers, community investment participation rates, and residential renewable energy adoption in surrounding areas. A South Australian agricultural waste-to-energy plant measures behaviour shifts by monitoring farmer participation in feedstock supply agreements and tracking household energy efficiency upgrades within a 50-kilometre radius.
These KPIs serve multiple practical functions:
- Pre-project community readiness assessment to inform go/no-go decisions
- Ongoing stakeholder relationship management and early conflict detection
- Identifying communication gaps that require targeted outreach
- Demonstrating social value and community support to investors and lenders
- Meeting regulatory requirements for social license documentation
- Improving project design based on continuous feedback loops
Long-term sustainability depends on maintaining engagement momentum. Established facilities revisit participation and awareness metrics annually, tracking how community connections evolve as projects mature. This ongoing measurement ensures energy infrastructure remains a community asset rather than an isolated industrial operation, building the enduring local support that defines successful renewable transitions.
Setting Meaningful Targets and Benchmarks
Setting meaningful targets for community engagement KPIs requires balancing ambition with realism. Start by establishing a baseline, gather initial data before your project launch through community surveys, demographic analysis, and attendance at introductory events. This baseline becomes your reference point, showing where engagement sits at day zero. Without it, you’re measuring progress against assumptions rather than facts.
Context matters enormously when setting targets. A small rural bioenergy project in regional Queensland won’t match the participation numbers of a major solar farm near Melbourne, and that’s fine. Compare your targets to similar projects: consider community size, remoteness, project scale, and the local history with energy developments. If neighbouring communities achieved 15% household participation in renewable energy consultations, that’s a more relevant benchmark than a national average that includes vastly different contexts.
Build flexibility into your targets by setting ranges rather than single numbers. Aim for 40-60 community members at initial workshops instead of exactly 50. Account for seasonal variations, summer holidays affect attendance, harvest periods impact farming communities, and school terms influence family availability. Break ambitious long-term targets into smaller milestones: if you want 30% community awareness after two years, set interim targets of 10% at six months and 20% at one year.
Most importantly, treat targets as living documents. Review them quarterly with community representatives and project staff. If you’re consistently exceeding participation targets, raise the bar. If awareness metrics lag despite your efforts, investigate why and adjust either the target or your engagement strategy. The communities you’re working with will change, and your KPIs should evolve alongside them.
Common Questions About Community Engagement KPIs
Community engagement doesn’t always follow a straight path, and project teams often grapple with practical questions about measurement. Getting clear answers helps turn KPIs from abstract concepts into working tools.
How many KPIs should a project track?
Most successful projects focus on 5-8 core KPIs rather than trying to measure everything. Choose metrics that align with your specific project goals and community context, ensuring you can realistically collect and act on the data.
How often should measurements occur?
Measurement frequency depends on project stage and KPI type. Participation metrics might be tracked after each event, while sentiment surveys typically run quarterly or biannually to capture meaningful shifts without survey fatigue.
What’s a good community participation rate?
Participation benchmarks vary widely by community size and project type. A rural bioenergy project might consider 15-20% household engagement strong, while urban initiatives often target 5-10% given larger populations and different engagement patterns.
How do you measure engagement quality versus quantity?
Quality metrics include depth of understanding (survey scores), repeat participation rates, and the substance of feedback received. These complement quantity measures and often prove more valuable for predicting long-term project support.
The distinction between leading and lagging indicators also confuses many teams. Leading indicators like workshop attendance and information requests signal future community support, while lagging indicators such as complaint rates or opposition letters reflect outcomes that have already occurred. Strong engagement programs track both, using leading indicators to adjust strategies before problems emerge.
Another common concern centres on interpreting results when KPIs don’t meet targets. Missing a benchmark doesn’t automatically signal failure. Context matters enormously, lower attendance at a summer consultation might reflect holiday schedules rather than disinterest, while a dip in social media engagement could coincide with platform algorithm changes. Smart project teams investigate the “why” behind every number, comparing results against local events, seasonal patterns, and community feedback to understand what the data truly reveals about their relationship with residents.
Community engagement KPIs transform abstract community support into measurable outcomes that strengthen Australia’s renewable energy future. By tracking participation, awareness, sentiment, and behaviour change, energy projects move beyond token consultation toward genuine partnerships that benefit both communities and the environment.
The Australian bioenergy sector demonstrates this power daily. Projects that measure and respond to community feedback create lasting local ownership, from regional biogas facilities supported by farming communities to suburban biomass heating systems championed by engaged residents. These metrics reveal what’s working, highlight areas needing attention, and build accountability that earns community trust over the long term.
Setting thoughtful KPI targets means recognizing that communities differ. What works in metropolitan Sydney won’t mirror engagement patterns in rural Queensland or coastal Tasmania. Flexible, context-aware measurement respects these differences while maintaining rigour. The goal isn’t hitting arbitrary numbers, it’s understanding whether your project genuinely serves the people it affects and adapts when it falls short.
Strong community partnerships don’t happen by accident. They require intentional effort, honest dialogue, and systematic measurement that proves respect for local voices. When energy developers commit to tracking engagement meaningfully, they don’t just build better projects, they build the social foundation that makes Australia’s renewable transition resilient, equitable, and truly community-powered. The data guides the path, but the relationships sustain it.